
Technical analysis is the practice of examining historical price data to make predictions about future price movements of cryptocurrencies. It involves analyzing charts, patterns, and indicators to identify trends, support and resistance levels, and potential entry or exit points for trading.
Technical analysts believe that past price patterns and market behavior can provide insights into future price movements. By using various tools, such as moving averages, oscillators, and candlestick charts, analysts aim to uncover potential buying or selling opportunities and assess the overall market sentiment. Technical analysis is widely used by traders to help inform their trading strategies in the volatile cryptocurrency market.
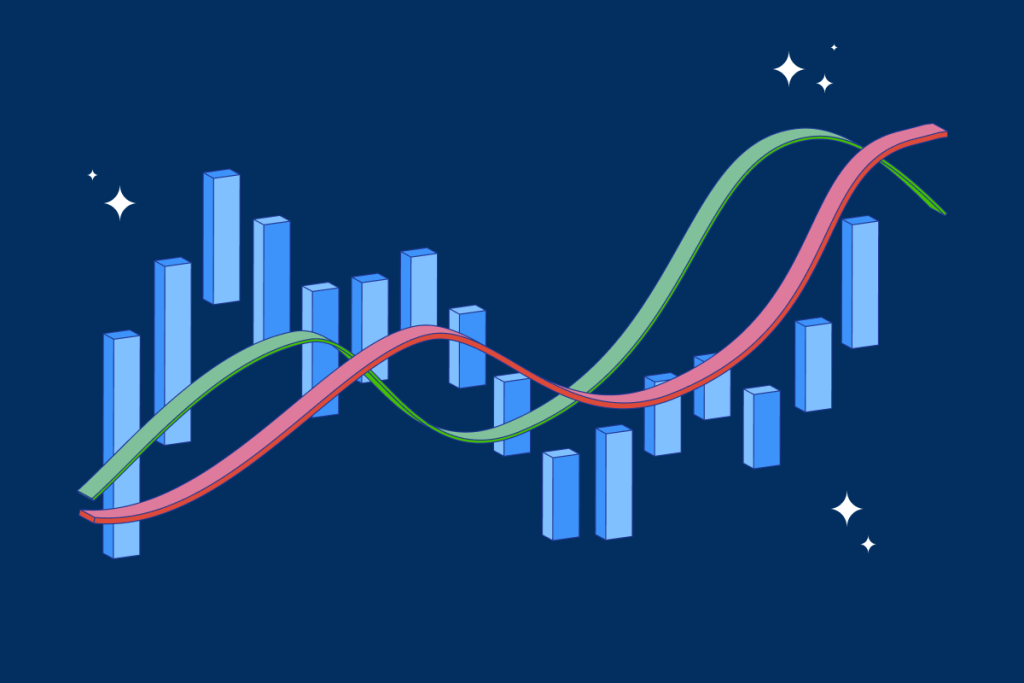
Leading indicators are a set of tools used in technical analysis to anticipate potential future price movements in the financial markets, including cryptocurrencies. These indicators are designed to provide early insights into possible market trends before they occur. Here are some commonly used leading indicators:
- Moving Average Convergence Divergence (MACD): MACD is a trend-following momentum indicator that compares two moving averages of a cryptocurrency’s price. It generates signals when the moving averages cross over or diverge, indicating potential bullish or bearish trends.
- Relative Strength Index (RSI): RSI measures the speed and change of price movements and helps identify overbought or oversold conditions. It ranges from 0 to 100 and is commonly used to anticipate potential trend reversals.
- Stochastic Oscillator: This indicator compares the closing price of a cryptocurrency to its price range over a specific period. It provides insights into overbought and oversold conditions, suggesting potential price reversals.
- Bollinger Bands: Bollinger Bands consist of a moving average and upper and lower bands that represent standard deviations from the average. They help identify periods of high volatility and potential price breakouts.
- Ichimoku Cloud: This indicator provides a comprehensive view of support, resistance, and trend direction. It includes multiple lines and a cloud area that helps identify potential entry or exit points.
- Fibonacci Retracement: Fibonacci retracement levels are based on mathematical ratios and help identify potential support and resistance levels based on previous price movements.
- Volume Analysis: Analyzing trading volumes can provide insights into market sentiment and the strength of price movements. Sudden increases or decreases in volume often precede significant price changes.
It’s important to note that while leading indicators can provide valuable insights, they are not foolproof and should be used in conjunction with other forms of analysis to make trading decisions.
Converting Cryptocurrency to Cash
Exchanging cryptocurrency to cash on Dart Africa is a straightforward process that doesn’t require extensive technical analysis. We provide competitive exchange rates, ensuring that users receive the best value for their cryptocurrency.

To sell your crypto on Dart Africa, you can follow these simple steps:
- Create an account: Sign up on Dart Africa and complete the verification process by providing the necessary details.
- Login to your dashboard: After successfully creating your account, log in to your Dart Africa account using your credentials.
- Go to the trade section: Go to the trade section within your dashboard and select the cryptocurrency you wish to trade. Dart Africa supports a range of popular cryptocurrencies such as BTC, USDT, ETH, BNB, LTC, and more.
- Input the amount of crypto: Specify the amount of cryptocurrency you want to sell. A unique wallet address will be generated for you to transfer your assets.
- Transfer your crypto assets: Initiate a transfer of the specified amount of cryptocurrency to the generated wallet address provided by Dart Africa. Wait for confirmation of the transaction on the blockchain.
- Crediting of funds: Once the transfer is confirmed, Dart Africa will credit the equivalent funds to your wallet.
- Access your wallet: Return to your dashboard and navigate to the wallet section. Select your preferred withdrawal option and supply the necessary details.
- Await funds: After submitting the withdrawal request, patiently await the processing of your funds. Withdrawal requests are processed instantly on Dart Africa.