Technical analysis is an incredibly common skill among crypto traders. It plays a vital role in helping traders make informed trading decisions based on historical price data and market trends. By studying charts, patterns, and indicators, crypto traders can gain insights into the potential direction of prices.
Technical analysis provides a framework for identifying entry and exit points, managing risk, and maximizing profit potential. Through the application of various tools, such as support and resistance levels, moving averages; traders can better understand the dynamics of the cryptocurrency market.
Learning crypto technical analysis can be a valuable skill for navigating the cryptocurrency market. Here are a few steps to get started:
- Study the basics: Begin by familiarizing yourself with the fundamental concepts of technical analysis. Learn about key terms like support and resistance levels, trend lines, indicators, and chart patterns.
- Choose reliable educational sources: Seek out reliable educational sources that provide beginner-friendly explanations of technical analysis. Look for platforms, blogs, or YouTube channels that break down complex concepts into simple terms and offer practical examples to enhance your understanding. Dart Africa provides educational resources specifically designed for newbies in the world of cryptocurrency.
- Start with popular indicators: Begin by learning a few commonly used technical indicators, such as moving averages, Relative Strength Index (RSI), and Bollinger Bands. These indicators can help you provide insights into market momentum.
- Analyze historical price charts: Practice analyzing historical price charts of different cryptocurrencies. Observe patterns, trends, and the relationship between price and volume. Identify chart patterns like triangles, double tops/bottoms, or head and shoulders patterns.
- Utilize demo accounts: Many cryptocurrency exchanges offer demo accounts where you can practice applying technical analysis without risking real funds. Utilize these accounts to test your strategies in a simulated trading environment.
- Join communities: Engage with cryptocurrency communities, forums, and social media groups dedicated to technical analysis. Participate in discussions, ask questions, and seek guidance from experienced traders.

Mastering technical analysis takes time, practice, and continuous learning. Stay patient, remain curious, and regularly review your trades to improve your decision-making abilities in the cryptocurrency market.
Common Chart Patterns in Cryptocurrency Trading
Chart patterns play a significant role in cryptocurrency trading as they provide valuable insights into market trends. Here are some common chart patterns:
Trend lines
Trend lines are straight lines that connect two or more price points, indicating the direction of a market trend. An uptrend is characterized by higher highs and higher lows, while a downtrend exhibits lower highs and lower lows.
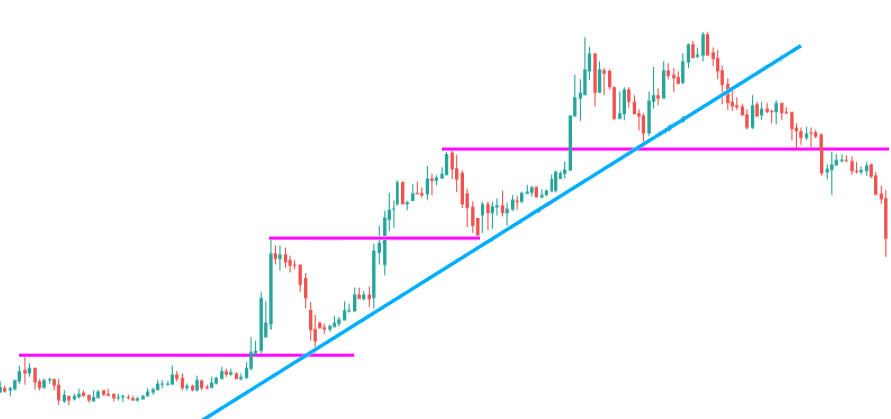
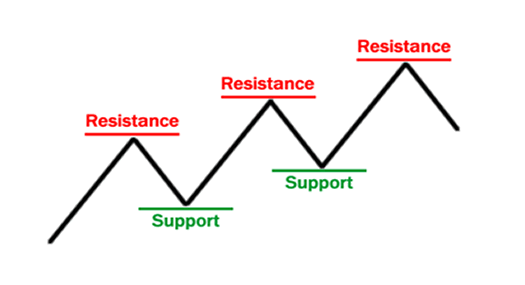
Support and resistance levels
Support levels are price levels where buying pressure is expected to prevent further downward movement, while resistance levels are price levels where selling pressure may halt upward movement. These levels act as barriers and can provide important signals for entry or exit points.
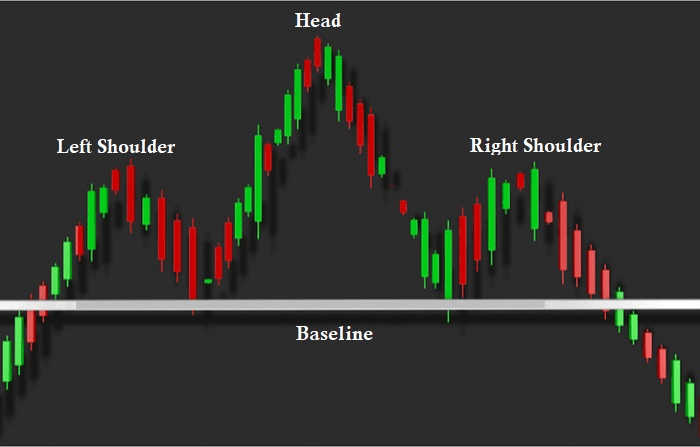
Head and Shoulders
The head and shoulders pattern is a reversal pattern that consists of three peaks, with the middle peak (head) being higher than the other two (shoulders). It suggests a shift from an uptrend to a downtrend and can indicate a potential selling opportunity.
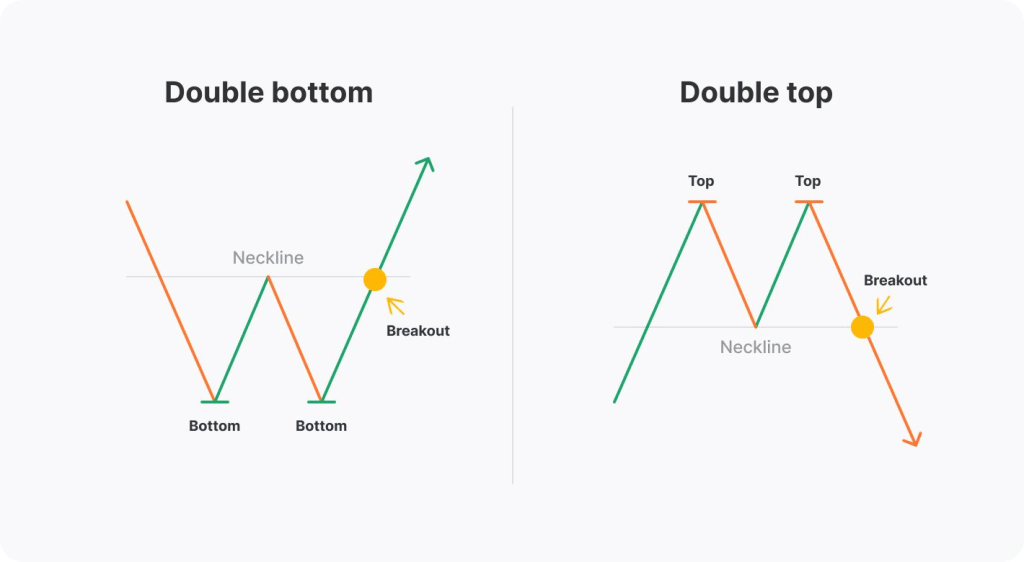
Double Top and Double Bottom
A double top pattern occurs when the price reaches a peak twice and fails to break above it, signaling a potential reversal from an uptrend to a downtrend. Conversely, a double bottom pattern occurs when the price reaches a low point twice and fails to break below it, suggesting a potential reversal from a downtrend to an uptrend.
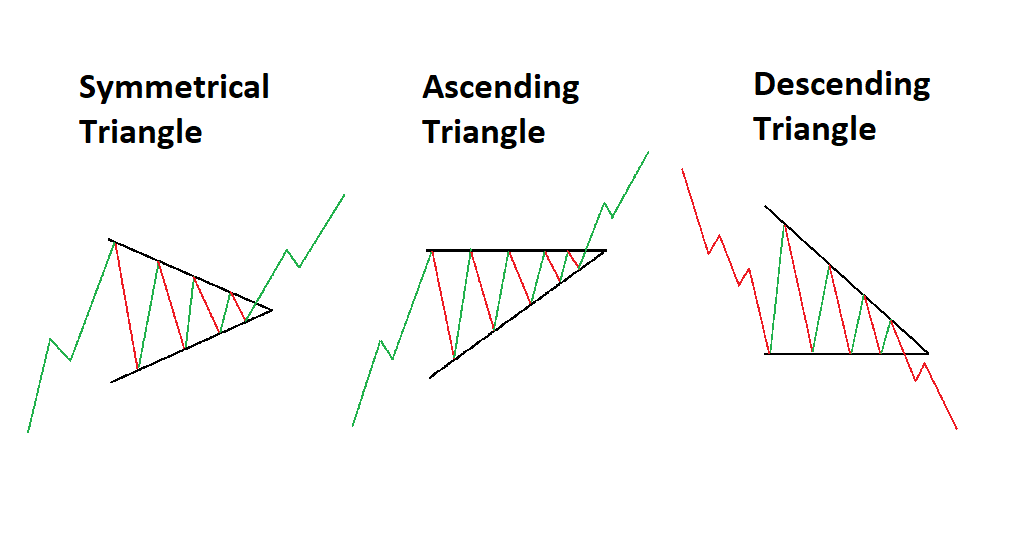
Triangle patterns
Triangles can be symmetrical, ascending, or descending, and they represent a period of consolidation before a potential breakout or breakdown. These patterns indicate a temporary equilibrium between buyers and sellers and can provide insights into future price direction.
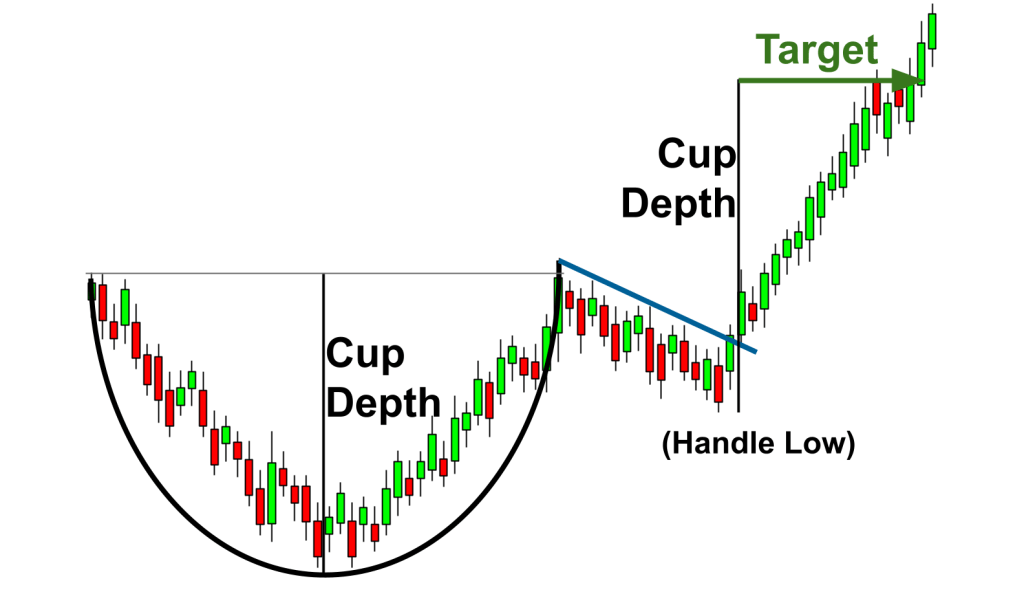
Cup and Handle
The cup and handle pattern resembles a cup formation followed by a smaller consolidation, known as the handle. It is considered a bullish continuation pattern, suggesting a potential upward movement after the consolidation phase.
Understanding these common chart patterns can assist traders in identifying trading opportunities, managing risk, and making informed decisions in the dynamic world of cryptocurrency trading.